Justin Sandefur
Center for Global Development
Blog

A couple years ago, Alan Krueger, then chairman of President Obama’s Council of Economic Advisers, made a big splash by highlighting a relationship he christened “The Great Gatsby Curve.” Simply put, data from multiple OECD countries showed that high income inequality was associated with less economic mobility.
The Gatsby curve struck a nerve, I think, because it suggested rising inequality was a threat to the mythology of America as a land of opportunity, where hard work is all it takes to succeed. Miles Corak, whose research underpinned Krueger’s original graph, posed the political question bluntly:
Is inequality a good thing, reflecting the fruits of skill and ambition and offering a promise of possibility for the next generation? Or does it skew opportunity, crudely mirroring the power of privilege and place and reflecting unfair barriers to success regardless of talent?
The Gatsby curve hints at the latter, uglier hypothesis.
So much for the American dream. But what about the rest of the world? My undergraduate textbook on development economics offered a more Panglossian scenario, in which growth and technical progress in developing countries necessitated an initial rise (then fall) in inequality, creating Kuznet’s inverted-U shape. Does the Gatsby Curve relationship hold for developing countries as well?
Comparable measures of intergenerational mobility aren’t always available outside of rich countries. Krueger’s original graph had just 11 countries, which others have extended to over 20. To expand further, I decided to look at the intergenerational transmission of learning outcomes in lieu of income. My alternative measure of mobility (or the lack thereof) is the relationship between parental wealth and children’s scores on the PISA exam. That takes us up to a sample of 52 countries with PISA and Gini inequality data, including developing countries like Vietnam, Indonesia, Brazil, and Peru. For Stata users, the .do files to recreate these graphs are available here.
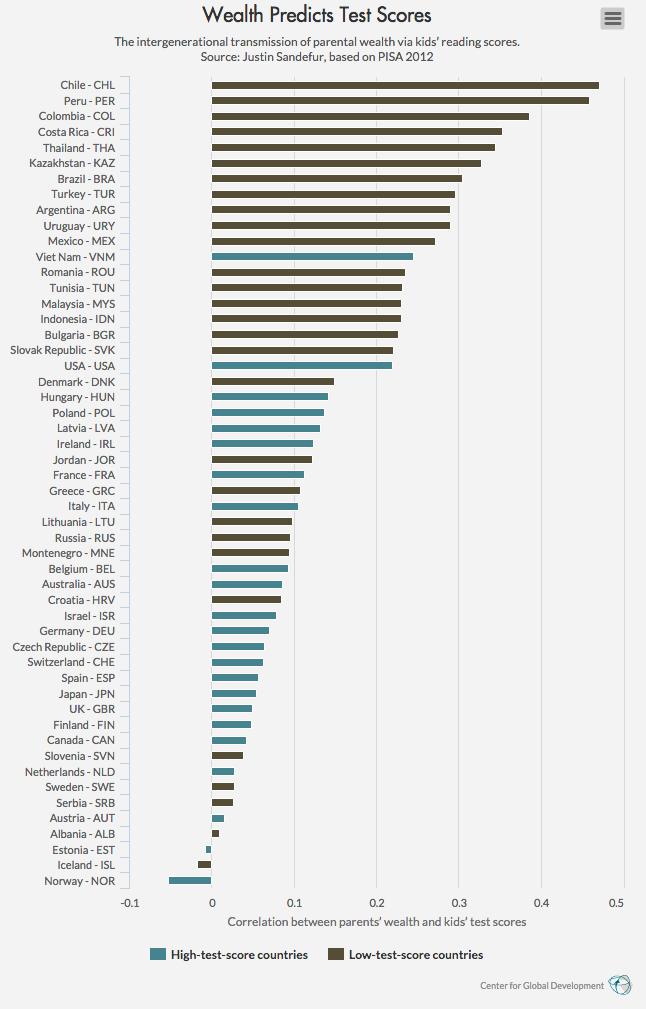
The PISA is a standardized test administered to 15-year olds in dozens of countries every three years, most recently in 2012. In an earlier post I showed the unsurprising result that rich kids do better on PISA, so much so that rich kids in poorer countries score just as well their counterparts in rich countries. The strength of that relationship between wealth and scores varies a lot though across countries.
If your household is one standard deviation richer than your neighbors in Brazil, you can expect to score about 0.3 standard deviations higher on the PISA. If you have the same wealth gap in Canada, you get basically no advantage in test scores.
Armed with these correlations, we can turn to the actual Gatsby curve. The results are striking.
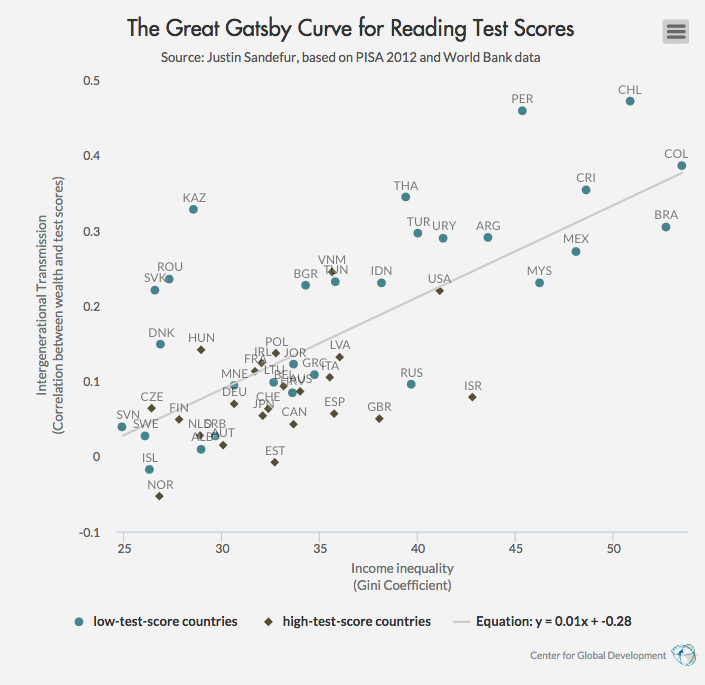
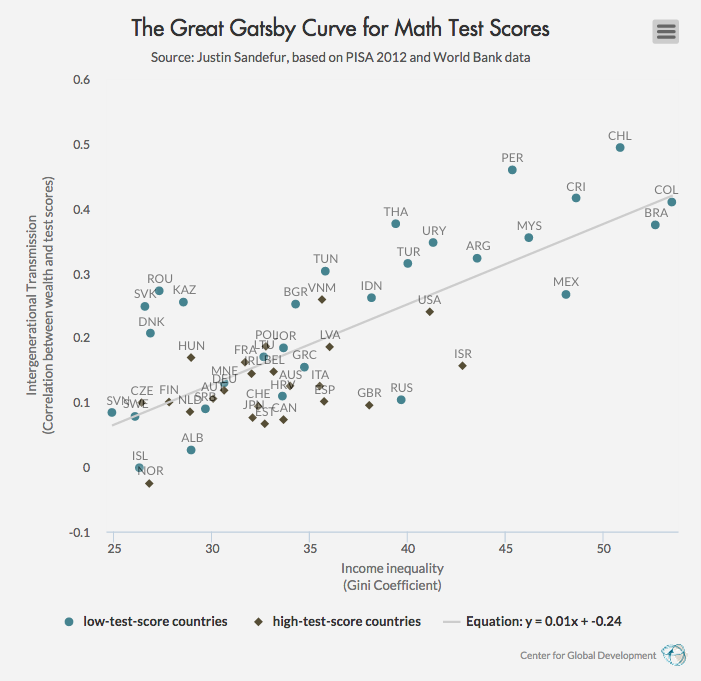
The graphs above shows that countries with high inequality have very big gaps in test scores between rich and poor kids. The correlation between the Gini coefficient of income inequality (on the horizontal axis) and my measure of intergenerational immobility (i.e., how well parental wealth predicts test scores, on the vertical axis) is high (about 0.71 for reading and 0.75 for math) and highly statistically significant.
Bear in mind that the Gatsby curve implies the poor are doubly damned. The upward slope means not just that rich people use their wealth to buy better education for their kids, but that as inequality increases, families with the same wealth levels pass on more of that advantage to their children. So not only is the economic divide between rich and poor wider in Brazil than Canada, its effects are also stronger dollar for dollar.
The results here mirror those found by John Jerrim and Lindsey Macmillan at London’s Institute of Education. They find that the Gini coefficient predicts both the rich-poor gap in numeracy scores, as well as university graduation and other educational outcome indicators for a smaller set of richer countries (h/t Lee Crawfurd).
It’s not obvious that the Gatsby Curve is actionable. Krueger has strongly implied that he thinks causation runs from inequality to low mobility (see last line here). If a policymaker asks you how to fix inequality of opportunity for kids at school, and you tell her to “first, fix income inequality,” she could be forgiven for laughing out loud. In general, I have a mild allergy to social science questions where the independent variable is a complex macro phenomenon rather than a policy lever, like the literature showing conflict undermines economic performance (great, now all we need is world peace) or climate change contributes to civil conflict (excellent, just solve global warming).
Krueger is a bit more optimistic, arguing that by casting the issue in terms of lack of opportunity, the Gatsby curve has broadened the ideological support for addressing inequality.
The two key remaining questions now are: (1) What are the main mechanisms underlying the Great Gatsby Curve? (2) What policy actions can be taken to improve economic opportunities for children born in disadvantaged circumstances? Learning more about the former can help us to achieve the latter — which is, in the end, the most important goal of all.
Finding a Gatsby Curve in test score data at age 15 can help with the first question. It implies that education quality is not only a key mechanism for intergenerational mobility (we probably knew that), but one that apparently shuts down in more unequal societies like Chile or Brazil.
It’s less clear the Gatsby Curve or even the underlying data can help with the second question. I’m fairly skeptical of the cross-country literature that has attempted to correlate scores on PISA and other standardized tests with features of schooling systems around the world, to determine the best arrangements to promote learning.
(Depending on your ideological inclinations, though, it might be really tempting to look at the Chilean data point in the graph — with super high inequality and intergenerational transmission — and speculate about the negative side effects of Chile’s nationwide adoption of private school vouchers in the 1980s.)
Perhaps more depressing, the Gatsby-curve relationship in test score data is a reminder of how closely intertwined our notion of academic merit is with economic inequality. By age fifteen, the advantages of being born at the top of a very unequal society already start to look like just desserts. From the perspective of employers and university admissions committees, plutocracy looks like a meritocracy.
This was perhaps all F. Scott Fitzgerald wanted us to learn. “‘Whenever you feel like criticizing any one,’” the narrator recalls his father telling him in the book’s famous opening lines, “‘just remember that all the people in this world haven’t had the advantages that you’ve had.’ … Reserving judgments is a matter of infinite hope.”
This blog originally appeared on the Center for Global Development website (9 July 2015).
RISE blog posts and podcasts reflect the views of the authors and do not necessarily represent the views of the organisation or our funders.