Lant Pritchett
Blavatnik School of Government, University of Oxford
Insight Note

A new book, The Politics and Governance of Basic Education: A Tale of Two South African Provinces, edited by Brian Levy, Robert Cameron, Ursula Hoadley, and Vinothan Naidoo (with a total thirteen contributing authors) is wildly ambitious and partially succeeds. I set out to write a review of this book, but I got carried away by wild ambitions myself as I did so. I realised that, to form my own assessment and appreciation of the book and its contribution, I had to articulate my understanding of the overall intellectual context in which and from which the book emerged. It will be difficult to articulate this context because, in my view, the book is about big picture development questions and, in part, uses the country of South Africa and the sector of basic education to address those big picture questions. However, without that context, simply describing or reviewing what the book says about basic education in South Africa misses most of the real intellectual action.
This book is ambitious because it simultaneously tackles a very hard question and argues, by demonstrating their use, that a set of analytical frameworks helps tackle that question—and, by broader implication, that these analytical frameworks will also help tackle other development challenges.
The very hard question the book wants to address is, “Why is learning achievement in South Africa so low?”
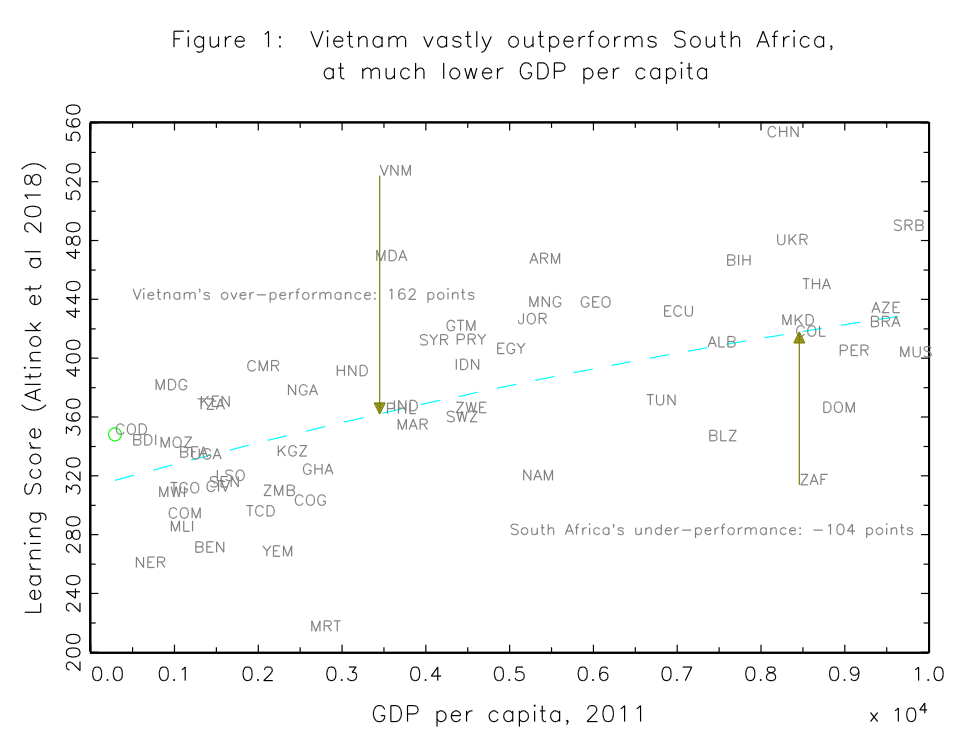
If one takes measures of learning achievement from the standard assessments as they have been recently aggregated into (broad) comparability (e.g. Patrinos and Angrist 2018), one finds South Africa is the single biggest learning underperformer relative to GDP per capita among low and middle income countries (<10,000 GDP per capita in purchasing power parity). In a simple association of learning outcomes (of the enrolled students) against GDP per capita, Vietnam has the best income adjusted performance (over-performing by 162 points)—reaching OECD levels of performance at low levels of income. Conversely, South Africa has the worst income adjusted performance (of countries with income less than P$10,000)—under-performing by 104 points. South Africa has the per capita income of Colombia or Thailand but the learning outcomes of Senegal or Cote d’Ivoire. The income adjusted gap between Vietnam and South Africa (e.g., the predicted difference in learning if they had the same GDP per capita) is an amazing 266 points. The scale is such that learning in a single year of schooling is around 30 or 40 points. At that rate, 266 points difference equates to about six and half years of schooling behind—which is way behind, considering that the assessments are meant to be in eighth/ninth grade.1
Moreover, South Africa does worse on learning in these data than Kenya or Tanzania, which have GDP per capita less than one-fifth of South Africa.
Chapter 6, “Explaining the Western Cape Performance Paradox: An Econometric Analysis,” makes this low performance even clearer and sharper. It uses the 2007 Southern and Eastern Africa Consortium for Monitoring (SACMEQ) assessment data to compare the learning of students in the Western Cape province with other regions (countries and provinces). Since SACMEQ has common household level variables one can compare how much better or worse a child from the same observed home background and socio-economic status would do in various places. Table 6.5 in the book shows that a child with the same home background and socio-economic status in Eastern Cape would do .70 standard deviations (sd) worse in Grade 6 literacy than in the Western Cape and a child in (Nairobi and Central) Kenya would do .27 sd better than in the Western Cape—a high performing South African province. This implies (assuming all is linear) that a child in Kenya with the same home background and income would have learning a full standard deviation higher than a child in the Eastern Cape in South Africa. Again, on the 30 to 40 points a year scale, this is roughly the same as being two or three grade levels ahead.
This is important as one reaction to the South African poor performance in the learning-GDP per capita space is to point out (rightly) that South Africa is a country with very high income inequality and this implies a typical person in South Africa is poorer than GDP per capita would suggest. But this isn’t (all of the) explanation. Chapter 6 shows performance of students by income quartile. Table 6.8 in Chapter 6, for instance, shows that students in the poorest quartile of schools in Kenya perform better on mathematics than students in the richest quartile of schools in Western Cape. So students in the poorest quartile of schools in Kenya do better than students in the richest quartile of schools in the best performing province of South Africa. This is despite the school average per capita consumption is 18 times higher in the Western Cape top quartile schools than in the Kenyan lowest quartile schools. And since Western Cape schools outperform Eastern Cape schools by about a standard deviation, this means the poorest students in Kenya outperform Eastern Cape students by a huge margin.
So the first ambitious question is to answer: Why does a child with a similar home background have learning of literacy and mathematics so much lower from being exposed to South African schools versus schools in other countries (like Vietnam) and even lower schools in much poorer African countries like Kenya?
The second ambition of the book is even grander, and harder to explain as it applies to developing thinking generally. This book is about South Africa and basic education, but in a deep sense this country (with provincial variations) and sector are being used as a prototype attempt to apply a general framework to understand the big development picture.
Brian Levy (together with others) has developed a framework for thinking about the politics and governance of development activities generally (Levy 2014 and Levy and Walton 2013) and this book is an extended application of that framework (there is also a forthcoming Oxford University Press book by Sam Hickey and Naomi Hossein using a similar politics and governance framework to analyse the quality of basic education in six countries).
To understand the Levy framework (for shorthand, not short-changing Walton) there are three steps of the evolution of development thinking about service delivery and I am going to convey them as succinctly as possible, even at the expense of simplification near the point of caricature.
The first stage of development thinking is what one might call the “institutional mono-cropping” (Evans 2004), “Seeing Like a State” (Scott 1998), “Solutions when the Solution is the Problem” (Pritchett and Woolcock 2004), or more prosaically, just the old fashioned “modernisation” view (Fukuyama). In this view, the politics and organisational capability of nation-states both naturally and organically follow a (roughly) linear process. For example, like the now “developed” countries (of Europe and then of Japan) who follow specific instantiations of political and organisational processes. These, in turn, produce good development outcomes. In this modernisation thinking, the apex form of politics is democracy, the apex form of (public sector) organisations is (Weberian) bureaucracy, and the development process for any given country is (linearly) getting more of those. This is so that all “politics” can, for instance, be usefully and uniquely arrayed as more or less democratic and all state administration can be arrayed as more or less Weberian creating good governance.2 If you combine the two phenomena of political and organisational transformation, you get better development outcomes, such as schools that produce learning. In this view, one would expect some countries to have low performance and others good performance in regards to public sector action (like learning in public schools) because some countries are more “modernised” (in this particular interpretation) than others.
The second stage was summarised and synthesised in the World Development Report (WDR) 2004 accountability triangle view. The document responded to three aspects of the modernisation view that were (given the experience of developing countries) obviously false and hence unhelpful as a guide to promoting development outcomes:
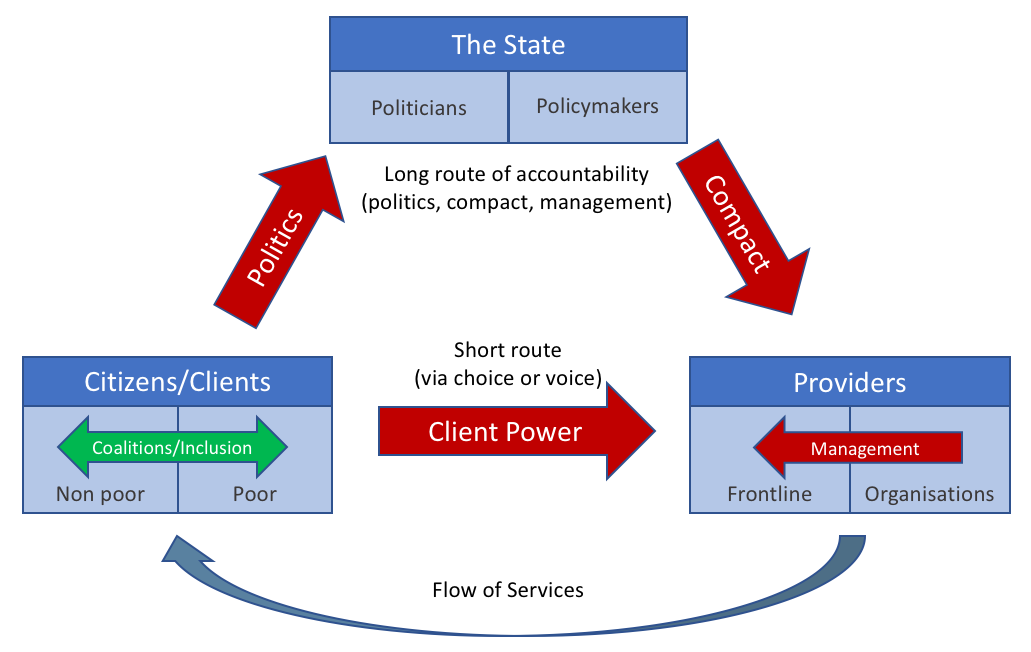
The WDR 2004 conceptual framework, and its instantiation as an easy to draw triangle as in Figure 2, addressed those three concerns by advocating accountability as a key feature of country (and sub-national) systems. The framework also acknowledged that effective service provision required a functional path of accountability either through the long-route (which was “long” because it required three function relationships of accountability to operate in order to be effective—politics, compact, and management) or the short-route of direct client power (which can work either through choice such as markets or voice such as direct participation and accountability to beneficiaries). The simplifying analytic element of the triangle was a common specification of what would lead to an effective relationship of accountability. It was argued that coherence among the four design elements of each accountability relationship: delegation, finance, information, and motivation would lead to better outcomes.
Source: Author's version (also Figure 4.1 in Levy at al 2018)
The second stage did three things:
This book acknowledges the WDR 2004 (Figure 2 is in the book as Figure 4.1) and self-consciously sets out to improve on that approach.
The Levy and Levy/Walton approach is therefore attempting (at least) a third wave (post-mono-cropping and post-WDR 2004) of discussing how governance affects development outcomes, and makes advances in two key ways:
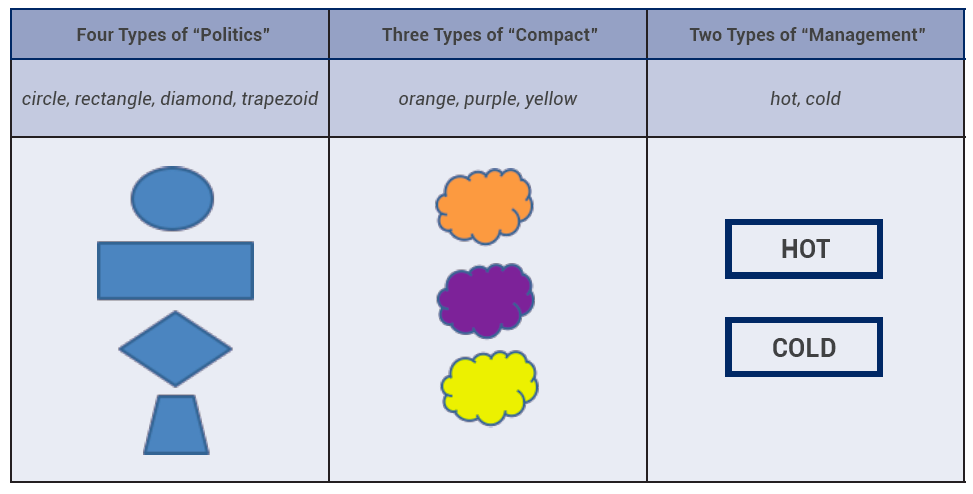
Abstractly (and it is better to understand it in this completely abstract way before getting into words loaded with normative—if not emotive—freight) imagine there are four analytic types of “politics”: circle, rectangle, diamond, and trapezoid; three types of “compact” relationship: orange, purple, and yellow; and two types of “management”: hot and cold. In this set up there are 24 arrangements (e.g., diamond-purple-hot, circle-yellow-hot) and, without further elaboration of a theory of the possible ways in which the three types interact, there is nothing to say which of the 24 are even possible or which of the combinations of politics, compact, and management are likely to be effective. It might be that the triplet: circle-purple-cold is impossible in the real world.
In our abstract word characterisation of politics, compact, and management, it might be that the combination of diamond-orange-hot would make an effective arrangement, but diamond-orange-cold would not work. Or, rectangle-yellow-cold would make for effectiveness, but rectangle-yellow-hot would not work. This interaction of course destroys any possibility of best practice as one cannot recommend “hot” or “cold” as the management type without knowing the rest of the system.
Source: Author's fevered imagination
The intent of the Levy framework is to make an advance on both of those fronts: to create an analytic typology of the types of politics and compact and then, based on this typology, to make an argument of which types of politics and compact can work together.
The Levy framework used in this book has three elements: (a) an analytical classification scheme for political settlements, (b) an analytical classification scheme for public governance, and (c) a specification of tiers of government and their relationships.
The Levy framework does not differentiate types of politics by regime type (e.g., authoritarian, democratic) but rather starts from the idea there are different types of political settlement (the idea of political settlement is not unique to this framework and is also associated with Mushtaq Khan’s (2010) work and others). More specifically and uniquely to Levy, these political settlements take four ideal types according to whether the settlement was “dominant” or “competitive” (in one analytic dimension) and “personalised” or “rule of law” (in another analytic dimension) as in Table 1.
| Dominant | Competitive | |
|---|---|---|
| Personalised | Elite cohesion is high, power exercised top-down by leadership, limited constraints on political actors. | Elite cohesion is low, settlement demands power change hands on electoral competitive basis, but “rules of the game” are personalised (this is also called “competitive clientelist”) |
| Rule-of-law | Elite cohesion is high, power is top-down, but actions are anchored in rules which institutionalise how power is to be exercised. | Politics is competitive, impersonal rules govern the exercise of power. |
Source: Chapter 1, pp13-14.
In addition to classifying political settlements, the Levy framework also classifies public governance into four idealised types. This is a characterisation of how public sector organisations—like ministries of education—operate. In this case the axes are “hierarchical” versus “negotiated” and “personalised” versus “impersonal.”
| Hierarchical | Negotiated | |
|---|---|---|
| Personalised | Implementation is hierarchical, a principle-agent structure, but agent compliance is based on personalised authority of the leadership, not a system of rules. | Neither formal rules nor well-defined hierarchy of authority are in place. Such agreements to cooperate as may emerge (and they may not) depend on the specific people involved. |
| Rule-of-law | Classical “Weberian” bureaucracy of top-down enforcement of impersonal rules and standard operating procedures. | Multiple stakeholders, each with significant independent authority, agreed on how to work together, and codify these agreements in formal, enforceable rules. |
Source: Chapter 1, pp13-14.
It is worth noting how far we are from the first generation modernisation approach. One of the 16 possibilities in the Levy framework is the combination of a political settlement that is “competitive-rule of law” with public governance that is “hierarchical-impersonal.” This one cell was the universally expected outcome of development in the modernisation/institutional mono-cropping view.
But now we can “mix and match”; it is possible to have a “dominant-personalised” political settlement with “hierarchical-impersonal” public governance.
For instance, one can think of Indonesia under Soeharto from 1967 to 1997 as a dominant political settlement—there was no electoral (or other) political competition and this power was “personalised”, while “rule of law” was, at best, a weak constraint on government action. But in many ways the public governance was run in top-down, rule-driven ways and government was effective both at repression and at logistical functions and hence one could characterise public governance as hierarchical-impersonal (the joke was that “the Indonesian government could do anything an army could do—and not coincidentally”).
One can also have a “competitive-personalised” political settlement (what is often called “competitive clientelist”) in which there is <insert any adjective> democracy in which people or groups compete for power based on promises to deliver specific private benefits to specific groups. This is combined public governance that is “negotiated-personalised” because how the government behaves depends on agreements between specific individuals and not particularly on formal, de jure, policies or organisation charts.
The intended advantage of this approach is to create a positive (not normative) framework for describing and analysing what types of policies will be adopted given the politics and how effectively those policies will be implemented, conditional on their adoption and hence, likely outcomes on various dimensions of service delivery outcomes.
| Classification of political settlement | Classification of public governance | Examples? | Positive politics of policy adoption (what types of policies will governments adopt?) | Positive model of policy implementation (what will actually happen in the organisations? what will “front-line” agents actually do?) | Positive model of predicting service delivery/human well-being outcomes (will the mail get delivered, will children learn, will police enforce the law? |
|---|---|---|---|---|---|
| competitive, rule of law (“democracy”) |
hierarchical, impersonal (“Weberian”) |
Denmark, USA, Australia | Those preferred by citizens, aggregated by intensity, organization, power | Government organizations will, in broad outlines, implement policies with fidelity | Good outcomes on measures of human well-being (within relatively small bounds) |
| dominant, rule of law | hierarchical, impersonal | Japan (LDP period 1955-93) | Those preferred by the dominant coalition (or forced on them for survival) | Government organizations will, in broad outlines, implement policies with fidelity | Good outcomes on those domains in which the dominant coalition overlapped with citizen goals |
| dominant, personalised (“authoritarian”) |
hierarchical, impersonal | Indonesia (Soeharto 1967-96) | Those preferred by the dominant person (and/or narrow coalition) | Government organizations will, in broad outlines, implement policies with fidelity | Good outcomes on those domains in which the dominant person (narrow coalition) chooses to deliver |
| competitive, personalised | hierarchical, impersonal | Tamil Nadu, India | Competition over rents and political appeal | Implementation of policies with modest fidelity | Moderate outcomes |
| competitive, personalised | negotiated, personalised | Uttar Pradesh, India | Competition over rents and political appeal | Poor implementation of adopted policies | Bad outcomes |
Source: Author's conjectures
Even the simple table reveals both the promise and the peril of this approach (discussed below).
As if that isn’t already a complicated enough framework, the Levy-Walton framework, when applied to service delivery activities that are transaction intensive (in the Andrews, Pritchett, Woolcock 2017 sense) require large numbers of front-line agents in direct contact with the intended beneficiaries (e.g., vaccinations). In particular, those that are implementation intensive (e.g., basic schooling, policing, or ambulatory curative care) require public sector organisations that span several levels, from province/state to district/county to town/village to specific identifiable units (e.g., schools, clinics, police precincts).
This combination of a two-fold classification of “political settlement” and “public governance” with tiers of government, leads to something like Table 4 (which reproduces Table 1.2 of the book). This parses the outcomes to be explained about the evolution and outcomes of the education systems in South Africa, and in particular in two provinces, into the level and what the determining factors might be.
As Chapter 2 in the book (by Luis Crouch and Ursula Hoadley) explains, there were massive changes in the basic organisation of the education system in the post-apartheid era in order to make the education system more equal in its spending allocations and to accommodate the new federal structure. These are obviously to be explained by national level factors.
At the other end of the scale, one can ask: “Why do students in this particular school tend to do well in terms of learning value added (that is, performance controlling for the performance expected based on the characteristics of the students), whereas this other school has low learning value added?” In this case, one might expect there to be two levels of explanation: a school might do poorly because of its ‘context’ (it is based in a provincial system that makes it difficult for it to perform well) or because of its particular characteristics (it might have a spectacular principal who makes for a good school even in difficult circumstances and constraints).
Explaining that children learn less in Eastern Cape schools because of the low quality of the Eastern Cape bureaucracy is of course only half an explanation that raises the question, “Why does the Eastern Cape education bureaucracy perform less well?” This has to be answered by appealing to contextual variables that differentiate the bureaucracy of the Eastern and the Western Cape provinces.
| Explanatory variables | ||
|---|---|---|
| Outcome to be explained | Institutions ("rules of the game") [uses two by two classification of "public governance"] |
Politics (stakeholders and power) [uses two by two classification of "political settlement"] |
| National level (I): New education sector budgetary and governance arrangements | [Post apartheid] inclusive political settlement | |
| National level (II): Quality of performance based management | Formal bargaining arrangements of ELRC | Interactions of key stakeholders under ANC umbrella |
| Provincial level: Quality of education bureaucracies | Higher level contextual variables | |
| Quality of inherited bureaucracies |
Electoral competition Configuration of power within governing political power Social composition of non-elite groups |
|
| School level: Quality of school level educational outcomes | Higher level contextual variables | |
|
Quality of provincial level bureaucracy De jure arrangements for school level governance |
De facto interactions with officials from department of education with union officials, and with other political stakeholders | |
| Concurrent level variables | ||
| De facto school level governance arrangements | Interactions between principals, teachers, school governing body, and other external stakeholders | |
Source: Table 1.2, Levy et al 2018, with some additions in brackets [ ]
One feature of the Levy approach that the tables above do not capture is that he also brings in a notion of the inclusiveness of the system into factors related to social composition which are obviously important in South Africa (and across provinces of South Africa) and other countries. Therefore, when Levy says “context” he means the political settlements, the public governance, and social composition (which comes into Table 5 below).
There are two terrific features of the analytic approach that help explain the persistently low and stagnant levels of schooling in some developing countries and the high performance of other developing countries.
The first positive of this approach is that it frees one’s mind from the tyranny of overly focusing on proximate determinants of success like “inputs” and “policy” as the explanation of variations in success in promoting learning across countries. Overcoming the mental tyranny of explaining success with proximate determinants is vitally important in three senses.
There is a very large empirical literature that attempts to associate differences in learning performance across schools/districts/regions/provinces/countries with available inputs, either as total budgets per student or in physical units (e.g., class sizes, availability of books, etc.). This literature shows, to anyone’s satisfaction, that differences in inputs can account for only a very small part of the observed differences in performance. Figure 1 above, for instance shows the distribution of the latest learning outcome scores used in the World Bank’s Human Capital Index against GDP per capita. The figure shows that Vietnam achieves learning levels even a bit higher than those of the “developed” (OECD) countries, while South Africa (as noted above) has outcomes lower than Kenya, even though its GDP per capita is twice as high as Vietnam. This suggests that, if Vietnam and South Africa were at the same level of GDP per capita, Vietnam’s students would be over 250 points ahead of South Africa’s by the end of basic education—which is an astounding amount—and one would guess little or none of those differences can be attributed to differences in budgets per student or measures of “thin” inputs (like class size).
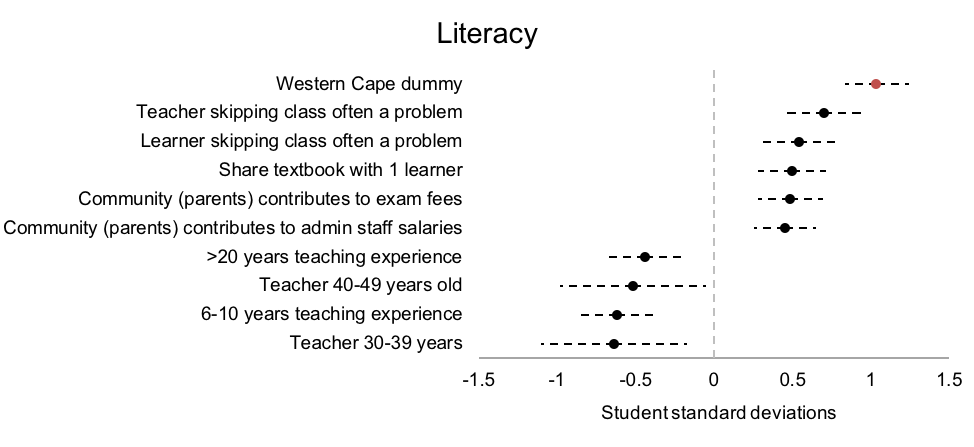
Chapter 6 of the book does an empirical exercise by using student level data from the SACMEQ 2007 data and doing multi-variate regressions of learning outcomes on all available explanatory variables. This includes information about the child (e.g., age and sex), the child’s household (e.g., household SES), and a whole variety of variables about the child’s school, including direct measures of inputs (e.g., textbook availability and class size), teacher characteristics (e.g., teacher qualifications), measures of pedagogy (e.g., use of classroom assessments), teacher dedication (e.g., teacher absenteeism), and measures of parental involvement (e.g., whether parents purchase furniture or contribute to teacher salaries).
The exercise shows that the difference in learning outcomes between the two South African provinces is not accounted for by differences in student composition, by observed input, or even policy outcome (e.g., teacher absenteeism) variables. The Western Cape province does not do better because of different inputs, but because they produce more learning with the same inputs.
Source: Spivack 2018
This framework is also important because it emphasises that explaining outcomes may not hinge on what policies are adopted or how the particular programmes it adopts are designed on paper, but on how those are actually implemented. This is a key insight as with the pressures for, and vectors of, isomorphism in the world (emphasised as a factor in the expansion of basic education by John Meyer for decades (e.g. here), countries are likely to look much more alike in terms of the legal forms and de jure policies than actual outcomes. To be more blunt, given the homogenising forces created by education schools and experts hired by development agencies, who are readily available to advise and draft policies, guidelines, and official curriculum, and the tendency towards “best practice” which encourages mimicking policies and practices that are not contextually feasible and appropriate, the wide span in performance we observe is more likely to be the result of an implementation gap between the de jure policies and de facto practices than in the practices themselves.
Three, non-education, examples:
Another way in which escaping from attempting to explain success in terms of proximate determinants is important is that if proximate determinants are the endogenously determined result of the operation of a system then explaining differential performance solely in terms of proximate determinants actually begs the question.
That is, suppose “time on task” of learning activities raises student performance. Suppose data across countries could show that a combination of (a) teacher absence from the school, (b) teacher absence from the classroom even while at school, and (c) weak teacher classroom management of time while in the classroom implied that students in country X were exposed to half the time on learning activities as in Country Y. This would all be empirically very interesting given the learning per time on task association accounted for Z percent of the observed learning gain differential across the countries. However, the country average of teacher absence from school and classroom, and of average teacher time management, are the aggregated result of choices made by of individual teachers. These are not features of the education system that are under the control of a policymaker or a manager but are endogenous outcomes of the operation of an education system. Without an explanation of why time on learning activities was so much lower in Country X than Country Y, this direct empirical attribution of learning differences (in terms of proximate differences) points to possibilities whereby Country X might improve learning, but not how they could achieve higher levels of these proximate determinants.
Therefore, a level of explanation of differential outcomes at the level of “proximate determinants of the proximate determinants” can be as useful and important as the explanation at the level of proximate determinants alone (perhaps more so).
The second positive feature of the framework and approach deployed in this book is that it starts from the premise that there might be very different ways of succeeding and very different ways of failing; something like “coherence” around performance objectives between the political, the administrative, and the tiers of agents/agencies/organisations engaged can be achieved in different ways.
If one begins to search for differences in observed learning outcomes in terms of features of the formal structure and design of education systems, it very quickly becomes obvious that there are a number of options. Many countries have near identical average learning performance even though, described at a macro-institutional level, their education systems are completely different. As described in Pritchett (2015), France, Germany, the Netherlands, and the USA have completely different approaches to basic education systems: France is centralised, Germany federalised, in the Netherlands money follows students across three (tightly regulated) sub-systems (government, Catholic, and Protestant), and in the USA control is almost completely local. Yet their learning outcomes in PISA are, in some domains, nearly identical.
This framework starts from the premise that there is no single answer and the combination may well matter. For example, since Indonesia and India had fundamentally different political settlements (after Soeharto’s seizure of control), in this framework there is no reason to expect the way in which Indonesia (administratively) might have success has to look like the way in which India could have had success.
To my mind the major negative of the framework is whether or not its underlying analytical classification in Tables 1 and 2 for “political settlement” and “mode of governance” will produce clear, agreed upon, outcomes when applied to cases.
Suppose I want to classify animals in a taxonomy. A good branching criteria is, “Does it have a spine?” which separates animals into vertebrates and invertebrates. This is good because in most instances experts can determine whether an animal does or does not have a spine and there are very few intermediate cases (“well, it kind of has a spine, but not really a ‘classical’ type of spine”).
A very bad branching criteria would be, “Is the animal beautiful?” for two reasons:
One, this is not a criteria on which one can expect to reach inter-subjective agreement (and objectivityis a subset of inter-subjective agreement) as I suspect many experts in crustaceans find lobsters pretty.
Two, there can be whole/part distinctions where an animal might have some features that are beautiful and some features that are not. I personally find the red head of the turkey vulture repulsive, but its two toned (black/grey) wings beautiful.
While I can find (as I tried to do so in Table 3) what I regard as “clear and compelling” classifications out of the two criteria (e.g., I think nearly everyone could be convinced that Denmark’s post WWII political settlement has been “competitive” and “rule of law”) when I try and use this classification for other countries and situations I think I know reasonably well, it starts to blur.
Take, for instance, the World Bank as an organisation. I worked there on and off from 1987 to 2007 and so have more than a casual acquaintance. On first blush it seems that the World Bank (which I often fondly refer to, à la James Scott, as “bureaucratic high modernism central”) is a classic Weberian bureaucracy and is therefore “hierarchical” not “negotiated” and “impersonal,” and not “personalised.” However, as Table 5 illustrates, from my own experience I can give examples of aspects of the reality of the World Bank as an actual organisation that fall into each of the four quadrants.
| Hierarchical | Negotiated | |
|---|---|---|
| Personalised | The relative performance of large units of the World Bank (Vice Presidencies, Directorships) seem to be quite affected by leadership as some people holding formal authority are unable to motivate performance with the “system of rules” but without “personalised authority”: 25% | Within country teams significant parts of the portfolio and tasks get moved across the standard hierarchical allocations of responsibility in order to accommodate specific individuals strengths or weaknesses (or inability to get along): 5% |
| Impersonal | World Bank writ large, seen from a distance, seems to be clearly here: 60% | In some significant functional areas, like private sector development, there are sufficient overlaps in what might be the domain (“turf”) of various units (e.g., International Finance Corporation versus IBRD’s Private Sector Development group) such that boundaries of work programmes have to be negotiated: 10% |
Source: Author's personal experience and guesses based on that
The difficulty is that people could then say: “Well, the World Bank doesn’t really fall into any one of these boxes.” At that level, I could guess one is going to get very few organisations classified with agreement into only one quadrant. One could implement this framework by allocating these by “percent of the total organisational phenomena in each box” to be the criteria, so, I could conjecture (as I have in bold) that it is 60, 25, 5, and 10 percent and hence its dominant type is “hierarchical, impersonal.” Suppose I had 10 people each of whom worked at the World Bank for 20 years or more do this same classification, would we replicate the same percentages as our “first cut?” Even if we were allowed to discuss, would we come to agreement?
Another example: I lived in India for four years, three of which were working with the World Bank interacting with the central government. I travelled around the country working with state and local governments and did some amount of research and work with Indian researchers on issues of India’s mode of public governance (e.g., Pritchett 2009). Could I assemble a group of experts and try to apply Table 2 at the country level for India? Or even a specific federal ministry? Or for a set of states (e.g. Tamil Nadu versus Uttar Pradesh)? Or for a specific ministry in a state (e.g., Ministry of Education in Himachal Pradesh)?
First, an analytical approach to political settlements is much better arrayed on a scale from “authoritarian” to “democratic” as the key descriptive features of politics. Much of the formal literature sometimes acts as if median voter models can be a workhorse model that provides a useful first cut on predicting outcomes. That does not work and this framework calls that out.
Second, treating the isomorphic shells of dysfunctional public organisations as if they were in fact Weberian bureaucracies, or even on the path to become such, leads to enshrining a projected fiction of the formal as fact (Pritchett 2012) and if one begins by accepting the fiction of the formal bureaucracy as fact, most of what follows will have no traction. That being said, there is still a long way to go from the conceptual advantages to the practical and applied use of the framework.
This piece has so far been quite “meta” rather than primarily about South Africa and education, in part because I work more on the “meta” and know little about South Africa, and in part because the book itself is an application of a general framework. However, there are two key lessons that emerge from the book that make this important to education in its own right.
The lessons emerge from the comparison of the Western Cape and Eastern Cape, which, as shown schematically in Table 5 (Table 10.1 in the book), emerge from the apartheid period with entirely different social, political, and bureaucratic contexts.
| Social | Political | Inherited institutions | |
|---|---|---|---|
| Western Cape | Diverse social composition—both ethnically and by economic class | Elites dispersed across multiple political parties with two broad groupings, competitive elections | Inheritance of “impersonal” bureaucracy |
| Eastern Cape | Homogeneous social composition—disproportionately poor and Xhosa-speaking | —ANC electorally dominant —Deep intra-party fragmentation |
Inheritance of patronage Bantustan bureaucracies |
Source: Table 10.1 of the book
In the Eastern Cape, the ANC (as a party) was completely dominant—but the political settlement was “personalised” due to deep and persistent intra-party differences among key ANC actors. At the same time, the Eastern Cape inherited very weak bureaucratic capability (due to its provincial bureaucracy being the result of a merger of former “Bantustan” bureaucracies) such that the Eastern Cape Department of Education, “…has been bedeviled by divergent and competing regional interests, organisational cultures, and patronage ties which consistently defied centralised control (p261).” Moreover, even when the central administration took over the direct control of the provincial department, this low level equilibrium proved resistant to change or improvement.
It is relatively easy to explain the very low learning performance in Eastern Cape in this framework as (a) the politically dominant ANC was under little or no electoral threat and hence any incipient political pressure from parents could be easily ignored (and, in any case, would be difficult to channel as the ANC dominated political organising) and (b) with a very weak bureaucracy even the rudiments of effective schools were difficult to create and sustain.
In contrast, the Western Cape emerged from the apartheid era in 1994 with competitive elections and a (relatively) strong bureaucracy and capable Department of Education. Hence, it is easy to explain its superior performance vis-à-vis the Eastern Cape, even controlling for student and school characteristics as shown in Chapter 6, as a result of those two features.
This assemblage of facts, framework, and argument would, in and of itself, be a useful, if somewhat predictable and common sense, set of findings: countries/provinces with more open political and competitive political systems and stronger capability in education bureaucracies are more likely to create strong learning.
But three facts push the book beyond this primary argument to more subtle and interesting conjectures.
First, while the strong bureaucracy and political competition of the Western Cape may explain why it has superior learning outcomes to the Eastern Cape, it doesn’t explain why the Western Cape does worse than Kenya—in spite of much higher income students and more resources.
Second, while much of the empirical analysis of differences in learning comes from the use of a regional survey (the 2007 SACMEQ because later scores are not available), South Africa has also participated in TIMSS (Trends in International Mathematics and Science Study) in 2003, 2011, and 2015. On TIMSS the Western Cape is a leading province, but it has been stagnant, while overall South Africa has improved impressively. On the TIMSS scores the advantage of the Western Cape over the Eastern Cape has fallen from 164 points in 2003 (only nine years post-apartheid) to only 24 points in 2015. Therefore, the framework needs to explain not only why the Western Cape was ahead, but why its once commanding lead over other provinces has been shrinking.
| TIMSS, Average Mathematics Score, Grade 8 and 9 or Grade 9 | |||
| 2003 | 2011 | 2015 | |
| Western Cape | 414 | 404 | 391 |
| Gauteng | 303 | 389 | 408 |
| Eastern Cape | 250 | 316 | 367 |
| South Africa | 285 | 348 | 368 |
Source: Table 10.4, selected rows
Third, Chapters 8 and 9 of the book do detailed case studies of four schools in the Western Cape and four schools in the Eastern Cape that track the performance of the schools over time and in particular examine the process of how new principals are chosen. The case studies examine the impact of how the provincial department bureaucracy, the existing teachers, the local politics, and horizontal governance, such as the official School Governing Boards (SGBs), interact in that selection process. They find, surprisingly, that in some cases in the Eastern Cape the weakness of the bureaucracy itself has allowed the SGB to emerge as powerful complimentary actors that were able to control the principal selection process and maintain a school’s high performance by resisting the pressures for a new, weak (but politically supported) principal.
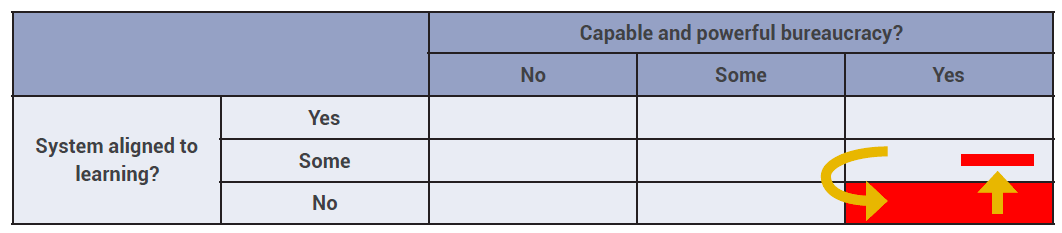
Figure 5 illustrates the potential dangers of a strong and capable bureaucracy, but which has inherited a focus on process compliance and does not have a strong drive for learning outcomes. In this case, the education bureaucracy can handle the logistical components of expanding education—building schools, procuring inputs, staffing schools with teachers and principals—but can do so in a way that is rules compliant rather than performance driven. Therefore, performance will be better than in an education system that is weak in both capability and in alignment with learning. However, there is a risk of a “black hole” dynamics in which the forces for preserving the status quo, even if it is delivering only a mediocre education, are strong.
Only those innovations that are both aligned with learning and compatible with the strong process compliance and logistical tendencies of the bureaucracy are possible (the vertical arrow in Figure 5), but those may well be insufficient to generate large, sustained, learning gains (as the evidence on “thin inputs” alone from around the world suggests). This puts an upward limit on the available gains.
Innovations also often involve some amount of positive deviance (Andrews, Pritchett, Woolcock 2017), that is, allowing at least some “fence breaking” activities in which agents/actors are empowered to innovate in ways not already sanctioned. If an organisation actually has no drive for learning performance as a goal then it will be easier and more acceptable for the Department of Education to not cede power to others (as that entails risks) and simply continue with the “business as usual” that is producing acceptable results and process compliance. This creates a black hole-like dynamics in which incipient reforms that might be capable of producing more rapid learning gains cannot escape the gravitational pull of the bureaucracy (for examples of this dynamic in India see Banerji 2015, Banerjee et al 2017, and Aiyar, Davis, and Dongre 2016).
Source: Adapted from Figure 10.1 and Brian Levy presentation Nov. 8, 2019
Chapter 10 of the book includes some arguments as to how the Kenyan system was able, with weaker bureaucracy and fewer resources, to sustain higher learning performance by having built a system with more commitment to learning and a great deal of local control which provided greater flexibility combined with regular measurement of performance.
The chapter draws on the World Development Report 2018 on education and its emphasis on “all for learning to achieve learning for all” which is similar to the emphasis of the RISE Programme on the fact that systems need to be coherent for learning. Both of these emphasise that the exclusive focus on the ministry or Department of Education as the source of drive for superior learning performance may be misguided. Rather, it may be necessary to bring other powerful actors (e.g., parents, civil society, business leaders, NGOs, and political movements) into play in order to shift the system towards alignment around learning and shock it out of a low-level equilibrium trap of process compliance.
Unexpected lesson from the Eastern Cape: The potential of horizontal governance when hierarchical accountability is weak
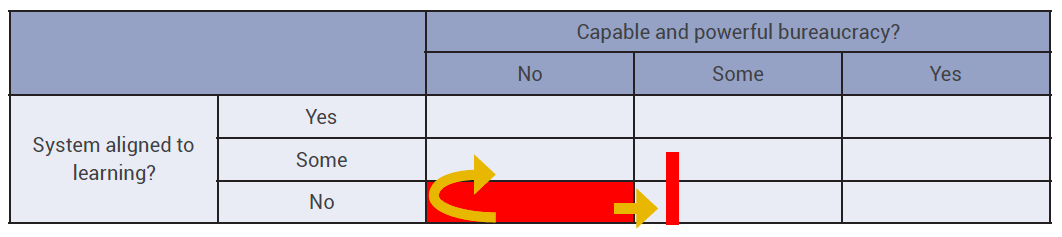
The Eastern Cape as described by the framework of political settlements (dominant-personalised) and public governance (negotiated-personalised) might seem, and is in many ways, a hostile environment for producing good outcomes. In South Africa, a national law mandated the creation of school governing bodies (SGBs). For the most part, these have been seen as too weak to stand up to powerful politicians, a strong bureaucracy and/or the strength of the teacher’s union (which is uniquely close to the ANC in the Eastern Cape).
Yet, the detailed case studies revealed that, at least in one instance, the SGB had become sufficiently mobilised that it successfully resisted the imposition of a principal who was known to be weak, but who was politically connected.
In contrast, the attempts to move directly towards a stronger school department bureaucracy, including an extended period in which the central government put the Eastern Cape Department of Education effectively into receivership and took direct control, were largely failures.
Source: Adapted from Figure 10.1 and Brian Levy presentation Nov. 8, 2019
While one doesn’t want to make too much of this potential for the creation of “islands of effectiveness” in a sea of weak governance, one does not want to make too little either. One alternative is the “counsel of despair,” that with existing governance (politics and public administration) nothing can be done. The other alternative is the “business as usual” practice of pretending to do the same set of bureaucratic reforms again and again in the hopes it might turn out differently this time (which is also a definition of crazy). The finding that horizontal governance (what the WDR 2004 calls “client power”) can work, at least in some circumstances, at least suggests a path forward while broader momentum for “all for learning” is built.
All of this is potential conceptual progress as one does not want to rely too much on evidence that boils down to eight schools, but I think in many ways we need the conceptual to guide next generations of the empirical.
This book, and the forthcoming book by Hickey and Husain that includes six other country case studies, constitutes an important step forward in the politics of learning in a number of ways. The overall method of examining and attempting to explain performance with models of the “proximate determinants of the proximate determinants” is important. The mix of studies of the national reform agenda, the provincial bureaucracies, empirical analysis of quantitative data, and case studies of particular schools is a model for integrating various strands of research around a coherent narrative.
The book’s warning about a “black hole of process compliance” is topical and important. In 2019, there are a number of global actors addressing the widely acknowledged learning crisis. Yet many seem complacent about the ability of existing government-led efforts to make progress by promoting “more of the same” and by spending more on thin inputs. This is in spite of the fact that solid evidence from both Indonesia and India—countries which have been aggressively expanding spending in “business as usual” ways—have actually experienced a deterioration in learning profiles over the recent decade.
In his November 2018 public presentation of the book, Levy concluded with four suggested steps:
While these may not be complete, exactly right, or even clear how to map into concrete actions, these messages resonate with those emerging from the World Development Report 2018 and from RISE. The messages almost certainly hold more promise of leading to practical action that accelerates progress in learning in basic education than the dangers of complacency, that “we” know what to do—and hence repeating, for a longer time and with more money, exactly what has not worked.
1 Figure 1 relies on the recent World Bank Human Capital Project learning estimates as they include many more estimates for low income countries than PISA and TIMSS. A fairer comparison might be the TIMSS results for South Africa which improve from 285 in 2002 to 372 in 2015 compared to PISA Mathematics for Vietnam of 525 in 2015. This implies a 240 point gap from South Africa in 2002 to Vietnam in 2015 shrinking to “only” a 153 PISA/TIMSS point gap in 2015. Even this gap is between five years (at 30 points per year) and almost four years (at 40 points per year) of learning gains.
2 I am using Weberian as shorthand even though of course many Asian systems had Weberian features thousands of years before Max Weber described emerging bureaucracies in Europe.
Pritchett, L. 2019. A Review Essay—The Politics and Governance of Basic Education: A Tale of Two South African Provinces. RISE Insight. https://doi.org/10.35489/BSG-RISE-RI_2019/010.