Michelle Kaffenberger
Blavatnik School of Government, University of Oxford
Insight Note

- Analysis of learning profiles fills important gaps in current understanding of learning outcomes by providing information on the dynamics of learning over multiple ages or grades, particularly in the primary years, and on progress towards universal learning goals.
- Learning profiles contribute to two main policy areas:
- By quantifying learning trajectories, they shed light on potential learning gains from expanding years of schooling (extending the learning profile) versus improving learning per year (steepening the learning profile), and on how resulting policy priorities will vary across countries.
- When disaggregated by group, they help diagnose inequalities in learning and inform policies aimed at achieving equality across groups and equity goals of universal skills.
- Because descriptive learning profiles can be analysed using many types of existing data, education ministries, researchers, or practitioners can use this typology, combined with a scan of available data for a particular country, to determine what types of learning profiles analysis are possible and will best meet the needs of that country.
While most low- and middle-income countries have succeeded in implementing massive increases in schooling in recent decades, in many countries around the world learning is in crisis (World Bank, 2018). It is not unusual for children to complete primary school and remain functionally illiterate. This leaves the world far from achieving learning goals such as universal literacy and numeracy, articulated in the 1990 Jomtien Declaration and more recently in Sustainable Development Goal 4. Despite widespread acknowledgement of low learning, however, to date the data needed to track learning trajectories, particularly in the primary years, have been sparse. Furthermore, understanding of the dynamics of learning across age and grade, how learning in the primary years affects achievement in the later years, and how these dynamics vary across groups, remains limited.
Many global and national efforts continue to prioritise expanding years of schooling, yet low learning per year means such efforts may yield minimal gains in student skills. There are tradeoffs in terms of resource allocation and prioritisation between expanding years of schooling and improving learning per year. Many countries will struggle to make substantial progress on both at the same time, making understanding of the learning that would result from each an important input to the planning process. Furthermore, understanding when children begin falling behind helps inform when in the schooling progression improvements are most needed. Analysis of learning profiles helps fill these gaps by providing new information on learning dynamics in many low- and middle-income countries. In many cases, descriptive learning profiles can be analysed using existing data, providing empirical low-hanging fruit for countries to use in informing their education plans and priorities.
What is a learning profile? Learning profiles represent the empirical relationship between schooling attainment and learning achieved, giving the learning of children completing each year or level of schooling. For an individual child, the learning profile is the additional learning (skill, capability, competency) the child gains from each additional year of schooling. In aggregate, a learning profile is the learning of a cohort of children, giving the average level and distribution of a skill or competency achieved by the cohort of children as they progress through each age or grade.
Analysis of learning profiles fills three key gaps left by typical cross-sections of learning outcomes obtained from national, regional, and international assessments. First, analysis of learning profiles covers multiple grade levels or ages, tracing out the progression of learning. This contrasts with most national, regional or international assessments, which test children in only one or a couple of grade levels.1 With data from only one or two grade levels, it is impossible to observe non-linear learning trajectories (which learning profiles show are common). Second, while many assessments prioritise later schooling years, such as testing at the end of primary or in secondary school, analysis of learning profiles typically covers the earlier primary years. This is especially important as evidence is increasingly showing that if children do not learn foundational skills such as literacy and numeracy in the early years of primary school, they are not typically able to catch up in the later grades. Finally, analysis of learning profiles typically covers a full cohort of children or adults, including children who are both in and out of school, or adults who completed varying levels of schooling (compared with national, regional, and international assessments, which typically only cover children who are in school). Such data on all children are necessary for tracking and understanding progress on universal learning goals.
Because panel data on learning is rarely available for low- and middle-income countries, analysis of learning profiles typically uses cross-sectional data covering many ages or grades. This analysis depicts descriptive learning profiles, giving the association between schooling and learning, but not necessarily the causal relationship. This means analysis of learning profiles can be subject to selection bias if lower performing children are more likely to drop out. Learning estimates become increasingly biased upwards as average learning is taken from an increasingly smaller subset of better-performing students who continue progressing through each grade. Two considerations are relevant here. First, many countries have achieved high levels of primary completion, meaning dropout in the primary years is relatively low, and thus selection bias in these years would also be relatively low. Secondary completion is much lower globally, so selection bias is likely to be more of an issue in the higher grades, and descriptive learning profiles of secondary years may need to be interpreted with more caution. Second, such upward biases will result in descriptive learning profiles that suggest higher learning than what is causally produced by schooling. If descriptive learning profiles suggest high levels of learning, then such bias could be an important cause for concern. However, the more common problem in many countries is that observed learning is very low, so the possibility of upward bias makes such low-learning results all the more troubling.
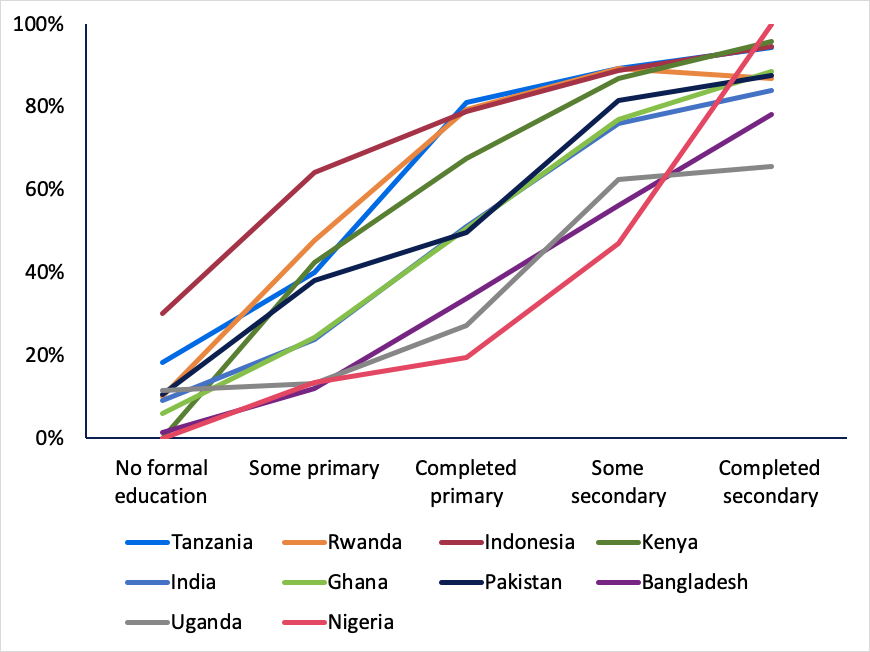
Figure 1 depicts examples of descriptive learning profiles analysed from Financial Inclusion Insights data, which contain a simple literacy test and measure of highest schooling level for a representative sample of adults in ten countries. The learning profiles show the percent of the cohort of young adults with each level of schooling who have achieved basic functional literacy. For example, in Nigeria among those with primary completion (and no higher), literacy is only 20 percent, while in Tanzania it is 80 percent. The slopes of the learning profiles vary substantially, and many are flat; in six out of ten countries, half or less of those with primary as their highest level of completion have achieved basic literacy.
The kinds of data needed to analyse descriptive learning profiles have become more widely available in recent years, and for many countries such data already exist. The data do not have to have been collected either specifically or exclusively to measure learning. Analysis requires, at a minimum, that an assessment of constant difficulty (or on a constant scale) is administered (through a high-quality survey or assessment process) to a cross section of respondents of varying levels of schooling completion. For example, the Demographic and Health Surveys recently began administering a simple literacy test to a subset of respondents, allowing analysis of reading abilities among women with different years of primary school attainment. Financial Inclusion Insights surveys, which are collected to understand the use of financial services in developing countries, include both a literacy and a numeracy test and information on highest schooling level attained. Other surveys are conducted specifically to understand learning outcomes, and learning profiles have been analysed based on several such surveys, including ASER and Uwezo surveys. Analysis of how descriptive learning profiles are changing over time can be conducted from repeated cross sections using the same assessment (or one of constant difficulty/scale).
Learning profiles contribute to two main policy areas. First, they can inform the potential learning gains from expanding schooling (extending the learning profile for more years) compared with learning improvements (steepening the learning profile), which in turn can help inform policy priorities. For example, a steep learning profile indicates that more years could add substantially to children’s cumulative learning, while a flat one means more years at current trajectories may produce little additional competency. Pritchett and Sandefur (2017) analyse descriptive learning profiles using DHS data and find that expanding years of schooling to universal primary completion in Ethiopia could improve women’s literacy by 57 percentage points, to 75 percent literate, and thus that prioritising more schooling may yield substantial gains. In Nigeria, however, they find literacy would only increase by 5 percentage points under such a scenario, so prioritising steepening the learning profile would yield much more learning.
Second, analysis of learning profiles can help diagnose inequalities in learning, for example through disaggregating learning profiles by gender, income (or wealth), or by racial or ethnic groups. Such analysis can show the potential (and the limits) of learning that can be achieved through equality goals, defined as equalising outcomes across identifiable groups such as boys and girls, and how far equality can get towards achieving equity goals, defined as universal basic skills (Crouch and Rolleston, 2017). Akmal and Pritchett (2019), for example, analyse disaggregated learning profiles and find that achieving education equality between the poor and the wealthy in five low- and middle-income countries would leave many without basic skills as even among the wealthy learning is often low on average.
Different types of learning profiles analysis can be produced from different types of data. The rest of this note outlines a typology of learning profiles, describing the benefits, drawbacks, and data requirements of each kind. Policymakers, researchers, and practitioners can use this typology along with a scan of the data available for a particular country to determine the types of learning profiles that can be analysed for that country.
There are three main types of learning profiles analysis, each of which draws on a different type of data source. This section discusses each type and the data needed for each, and gives examples.
Contemporaneous Cross-Section (CCS) learning profiles show the acquired learning of a cross-section of children in a range of ages and grades. “Contemporaneous” reflects that they are based on assessments of children as they are currently learning. “Cross-section” reflects that they represent a cross-section of children of different ages and at different stages of schooling at a particular point in time.2
By describing learning of current children, CCS learning profiles provide an assessment of the current state of the education system. They allow analysis of current learning trajectories across grades and current differences across groups, such as by gender or wealth group. For example, they can show what percent of third-graders can answer a math problem, or whether there are differences in literacy rates between Grade 5 girls and boys. If the assessment used covers a full cohort of children—those both in and out of school—then the learning profiles also allow analysis of current progress towards universal learning goals.3
ASER surveys, conducted in India and Pakistan, and Uwezo surveys, conducted in Kenya, Tanzania, and Uganda, both provide examples of assessments that can be used for analysing CCS learning profiles. Conducted across large samples of cohorts of children—more than 700,000 children in the case of India—they allow analysis of learning outcomes and differences across groups, and they cover children who are both in and out of school. UNICEF’s Multiple Indicator Cluster Surveys (MICS) added a children’s learning assessment for its most recent round, which will also allow analysis of CCS learning profiles. If assessments are conducted at multiple points in time and the difficulty is kept constant over time, repeated CCSs can show how learning (and learning profiles) are changing over time. For example, the ASER surveys in India have been conducted among repeated cross sections of children regularly since 2005. Analysis of learning profiles from these data sets have shown trends in reading and math abilities during this period (ASER 2018). Repeated CCSs can also show if any gaps between groups are shrinking or growing.
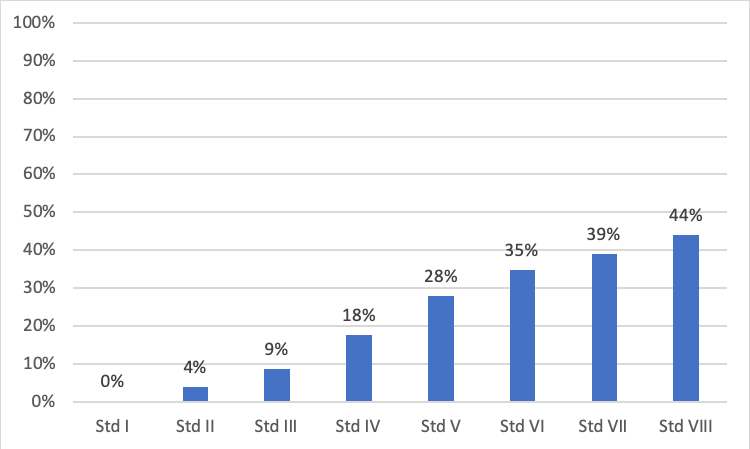
Figure 2 provides an example of descriptive learning profiles analysed from ASER India data. It shows the percent of children in each grade level who can solve a numerical division problem, a skill that corresponds with the Standard III/IV (Grade 3/4) curriculum. By Standard V, 28 percent of children can correctly solve the problem, and by Standard VIII this has increased to only 44 percent.
Examples of Contemporaneous Cross Section learning profiles:
Adult Retrospective (AR) learning profiles show competency levels of a cross-section of adults who completed varying levels of schooling. Because they use assessments of adults, AR learning profiles illustrate retained learning: the learning adults achieved and retained into adulthood. This can be beneficial as retained learning illustrates the concepts and skills that were sufficiently mastered to carry into adulthood, whereas learning outcomes among children can be driven by content memorised through rote learning or test-focused preparation, without associated conceptual mastery. Simple learning assessments among adults are also available for many more countries than learning measures among children.
Descriptive AR learning profiles can often be created from existing datasets, including datasets that are collected for non-education related purposes. For example, the Demographic and Health Surveys (DHS) added a literacy assessment for women with less than secondary schooling in recent rounds of data collection, providing a way to analyse literacy levels among a subset of these nationally representative samples.5 Financial Inclusion Insights surveys are conducted to understand the use of financial services in ten low- and middle-income countries, and they include literacy and numeracy tests that allow analysis of AR learning profiles for nationally representative samples. MICS include literacy tests for men and women with primary schooling or less.6 Analysing learning profiles using such existing data sources is low-hanging fruit for understanding learning levels and variation in many countries.
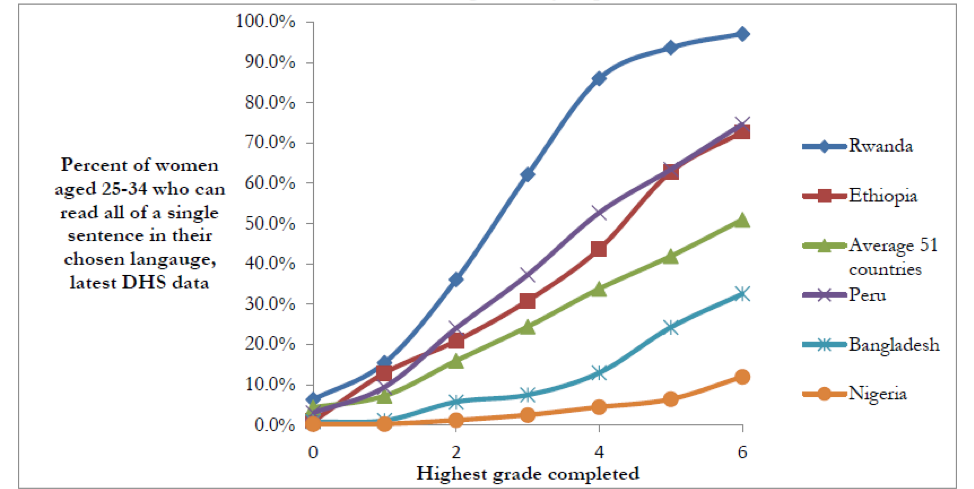
Figure 3 depicts learning profiles analysed using DHS surveys, showing large variation in learning among young women across countries. Among those with six years of schooling (and no higher) literacy ranges from about 10 percent in Nigeria, to nearly 100 percent in Rwanda, and on average across 51 countries only about half are literate.
A consideration when analysing AR learning profiles is that because they involve assessments of adults, they reflect the learning that the education system was producing some years ago. A twenty-five-year-old would have been in Grade 6 thirteen or fourteen years earlier; a fifty-year-old would have been in Grade 6 nearly forty years earlier. Because of this, AR learning profiles are most useful for understanding recent learning trajectories when created by analysing a young-adult cohort. Furthermore, if a country has undertaken major education reforms in recent years, then AR learning profiles may not be the best option for understanding current learning.
Examples of Adult Retrospective learning profiles:
True Panel (TP) learning profiles use longitudinal data that follows the same children over multiple years of school to measure learning gains per year. These can be thought of as “pure” learning profiles as they track actual gains of an individual child or group of children per year. If the assessment continues to track and assess children who drop out of school, they can provide useful information on cohort learning and learning retention as well. Panel data allow analysis of how the learning of children with different initial abilities progresses during the schooling years. Does their learning converge or diverge as children progress through school? Are some groups of low performers more likely to catch up to better-performers than others? These kinds of questions and many others are well suited to being addressed with panel data.
Longitudinal data on children’s learning, however, is rarely available in low- and middle-income countries. Data collection is costly and requires multiple years and rounds of data collection to obtain results. A unique example is the LEAPS study, which has tracked a sample of children in Pakistan since 2003 (Andrabi et al, 2008). The study is now following 10,000 children into adulthood to connect schooling and learning profiles to labour force outcomes. The Indonesian Family Life Survey provides another example. The survey has tracked a nearly-nationally representative sample of households through five rounds of data collection from 1993 through 2014. It administered a series of five math questions to survey respondents, thereby providing a measure of learning over time (Beatty et al, 2018).
Examples of True Panel learning profiles:
Learning profiles contribute to education system planning by providing information on the dynamics of learning across grades. They can help inform policy priorities by providing analysis of the potential gains from increasing learning (steepening the learning profile) and expanding schooling (extending the learning profile). By providing information on when children fall behind, including in the primary years, they show when in the schooling progression improvements are most needed. And, by showing differences across groups, analysis of learning profiles can provide new information on who is learning and who is not, informing efforts to improve learning for all.
This note provides a typology of three types of learning profiles analysis: Contemporaneous Cross-Section learning profiles, Adult Retrospective learning profiles, and True Panel learning profiles, each of which uses different types of data to shed light on the dynamics of learning. As large-scale surveys increasingly add skills assessments, such as literacy and numeracy tests, the opportunities for learning profiles analysis will only grow, and the opportunities for education actors to make empirically-informed decisions about system priorities will continue to increase.
1 For example, in the UNESCO Institute of Statistics database of national learning assessments, 35 (out of 46) Sub Saharan African countries are listed as having national learning assessments of some kind, but of these only 17 have assessments that cover multiple grade levels. Only 11 have national assessments covering three or more grade levels, allowing assessment of learning progress over more than two points in time.
2 This contrasts with learning profiles based on panel data, which would track the same children over a period of time
3 This typically requires surveys conducted at the household or community level, rather than in school.
4 Appendix A shows learning by grade level for each country.
5 They would, of course, provide even more opportunities for analysis if the assessment were administered to all respondents.
6 While these examples cover basic skills, such as literacy and numeracy, these skills are often not being mastered by the majority of individuals in many low- and middle-income countries.
Kaffenberger, M.2019.A Typology of Learning Proiles: Tools for Analysing the Dynamics of Learning. RISE Insight Series.2019/015. https://doi.org/10.35489/BSG-RISE-RI_2019/013.