Mesele Araya
Research for Equitable Access and Learning (REAL) Centre, University of Cambridge
Blog
We introduce a method to adjust for dropout while calculating learning gained by a cohort over a school year.

Research for Equitable Access and Learning (REAL) Centre, University of Cambridge

Research for Equitable Access and Learning (REAL) Centre, University of Cambridge

As primary school enrollment rates continue to increase in low-income countries, attention is shifting away from factors that affect attendance and towards those factors that affect learning. Put simply; it is not enough to get children in school; it is of considerable policy importance to understand what factors affect how much they learn. A common approach to this issue is to test children at the start and end of the school year and estimate a “value-added” model. The outcome variable is the end-of-year test score. This is a function of the start-of-year test score and other variables, including child, parental, teacher, and school characteristics.
Estimating value-added models, however, is not as straightforward as it might seem. One issue that frequently arises is that children may drop out over the course of the school year, maybe ill, or may have their schooling interrupted by factors such as floods or civil conflict. We call this sample attrition. These attritions are potentially problematic in two ways: (1) The smaller sample sizes at the end of the year reduce statistical power; (2) Where sample attrition is non-random, there is a risk that parameter estimates in the value-added model will be biased. In our Research for Improving Systems of Education (RISE) Ethiopia 2018-19 survey data, 19 percent of children (that is, 723 children out of an initial sample of 3901) who took our mathematics test at the start of Grade 4 in October 2018 did not complete the end-of-year test in May 2019. This blog post explains how we address this sample attrition in our RISE-Ethiopia 2018-19 survey. While our results are specific to our data, the method is generalisable.
The approach we take, based on work by Fitzgerald, Gottschalk, and Moffitt (Journal of Human Resources, 1998), is to create sample attrition weights. These are constructed by estimating two models of loss to follow-up measures or, more simply, attrition: one where we estimate attrition as a function of the variables that we think affect our outcome of interest (here, endline math scores); and a second where we estimate attrition as a function of the variables that we think affect our outcome of interest (end-of-year math test scores) and variables that we think only affect the likelihood that the child stays in school. We estimate predicted probabilities of remaining in school from both models; Fitzgerald, Gottschalk, and Moffitt show that the weights are the ratio of these predicted probabilities.
There are nine steps to doing this:
For the purposes of illustration, we assume that end-of-year math scores are a function of:
Collectively, these are the X variables.
We identify three variables that we think might affect whether the child is present for the end-of-year math test but do not directly affect math test scores. These are:
These are the Z variables.
Run the attrition regression with both the X and Z variables as regressors. Here the dependent variable =1 if the child completed the endline test, zero otherwise. We use a linear probability model; our standard errors account for clustering at the sampling unit, the school. A negative coefficient means that that variable is associated with a lower likelihood that the child completed the end-of-year test; a positive coefficient means that that variable is associated with a higher likelihood of test completion.
|
Variable |
Coefficient |
Standard error |
P value |
|---|---|---|---|
|
Child has lived in the locality for five years or less (=1 if yes) |
-0.053 |
0.024 |
0.03 |
|
Road to school is a mud track (=1 if yes) |
-0.033 |
0.021 |
0.12 |
|
Number of older children in household attending school |
0.013 |
0.013 |
0.02 |
|
|
|
|
|
|
Start of year math score |
0.0004 |
0.000007 |
<0.01 |
|
Age |
-0.019 |
0.004 |
< 0.01 |
|
Sex (=1 if boy) |
-0.026 |
0.012 |
0.03 |
|
Household wealth index |
0.013 |
0.007 |
0.05 |
|
Math teacher scored in the highest tertile on math content test |
0.006 |
0.022 |
0.80 |
|
Constant |
0.856 |
0.056 |
<0.01 |
Children who are recent arrivals to the locality are less likely to be tested at the endline (put differently, they are more likely to drop out); when the road to the school is of poor quality (i.e., a mud track), though the coefficient is just outside usual significance levels, children are less likely to be tested at endline; and children in households with older children also attending school are more likely to complete the endline test (put differently, they are less likely to drop out).
The F statistic on the joint significance of the three Z variables is 3.85 with a p-value of 0.011. This gives us confidence that we have variables that affect the likelihood of completing the end-of-year math test.
These are omitted for brevity but are available on request.
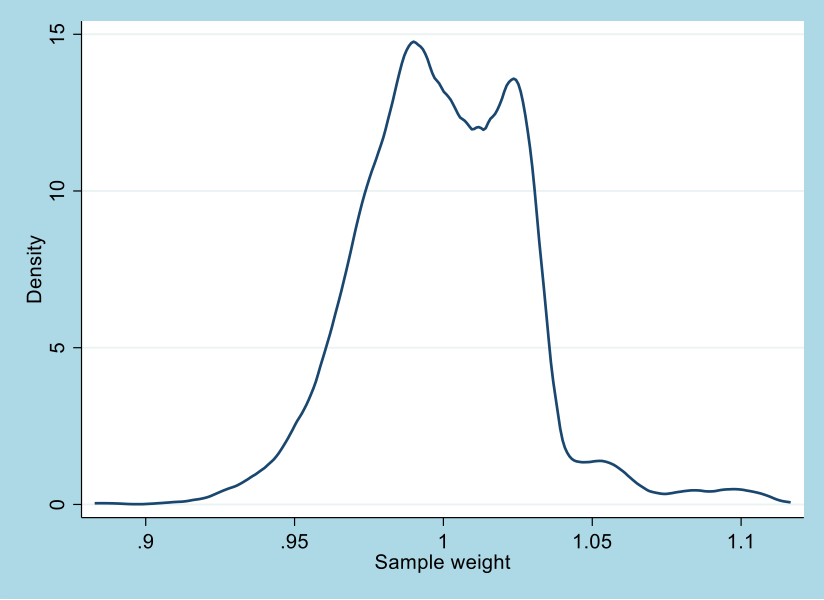
Calculate the attrition weights. Having done so, we can graph their distribution using a kernel density function. There is some variability in the weights – they range from 0.88 to 1.12 – but the mass of the distribution is around 1. This hints at the possibility that the attrition-weighted regression estimates will not differ too much from the unweighted regressions.
Lastly, we estimate our value-added model without and with the sample attrition weights.
Here are the regression results, where the outcome variable is the end-of-year math score without the weights.
|
Variable |
Coefficient |
Standard error |
P value |
|---|---|---|---|
|
Start of year math score |
0.78 |
0.023 |
<0.01 |
|
Age |
3.48 |
0.98 |
<0.01 |
|
Sex (=1 if boy) |
2.80 |
2.76 |
0.31 |
|
Household wealth index |
1.93 |
1.82 |
0.29 |
|
Math teacher scored in the highest tertile on math content test |
16.27 |
4.89 |
<0.01 |
|
Constant |
86.84 |
13.94 |
<0.01 |
After controlling for baseline test scores, child age, sex, and household wealth index, having a teacher in the top tertile of scores of the math test we administered to teachers is associated with an increase of 16 points on the endline math score.
And here are the regression results, where the outcome variable is the end-of-year math score, with the attrition weights.
|
Variable |
Coefficient |
Standard error |
P value |
|---|---|---|---|
|
Start of year math score |
0.78 |
0.023 |
<0.01 |
|
Age |
3.46 |
0.98 |
<0.01 |
|
Sex (=1 if boy) |
2.83 |
2.77 |
0.30 |
|
Household wealth index |
1.97 |
1.83 |
0.28 |
|
Math teacher scored in the highest tertile on math content test |
16.33 |
4.88 |
<0.01 |
|
Constant |
87.00 |
13.90 |
<0.01 |
The weighted parameter estimate for math teacher content knowledge is virtually the same as the unweighted estimate. So, in this case, sample attrition does not appear to be biasing these associations.
It is important that researchers estimating these value-added models construct sample attrition weights using data appropriate to the settings where their study takes place. To that end, the method described here is relatively straightforward to estimate.
RISE blog posts and podcasts reflect the views of the authors and do not necessarily represent the views of the organisation or our funders.